Value a company end to end
You have read the statements, built a model, and learned two ways to value a business. Now put it together on a company the course has never worked through. Choose one of three, value it from its FY2024 filing with a discounted cash flow and a set of comparables, and reach a defensible view on whether the shares look cheap, fair, or expensive. The three were picked because they end up in three different places, which is the point.
Try it yourself first. Pick a company below, open a blank workbook, pull the figures from its 10-K, and build the valuation before you read on. Then open that company's guided walkthrough to check your reasoning, and download the full solution file to trace every formula. The point is not to match every decimal, it is to reproduce the thinking: gather the inputs, judge the cash flow, value the business two ways, and weigh the result against the market.
One, gather the figures from the filing. Two, decide on a base free cash flow, starting from operating cash flow minus capital expenditures and normalizing anything that will not recur. Three, run a DCF: grow that cash flow, discount it at a WACC, add a terminal value, and bridge from enterprise value to a per-share value using net debt. Four, cross-check with comparable companies. Five, triangulate against the market price and form a view. Discount rates, peer multiples, and the recent market price below are illustrative teaching inputs.
NIKE, Inc. (NKE) · FY2024, ended May 31, 2024
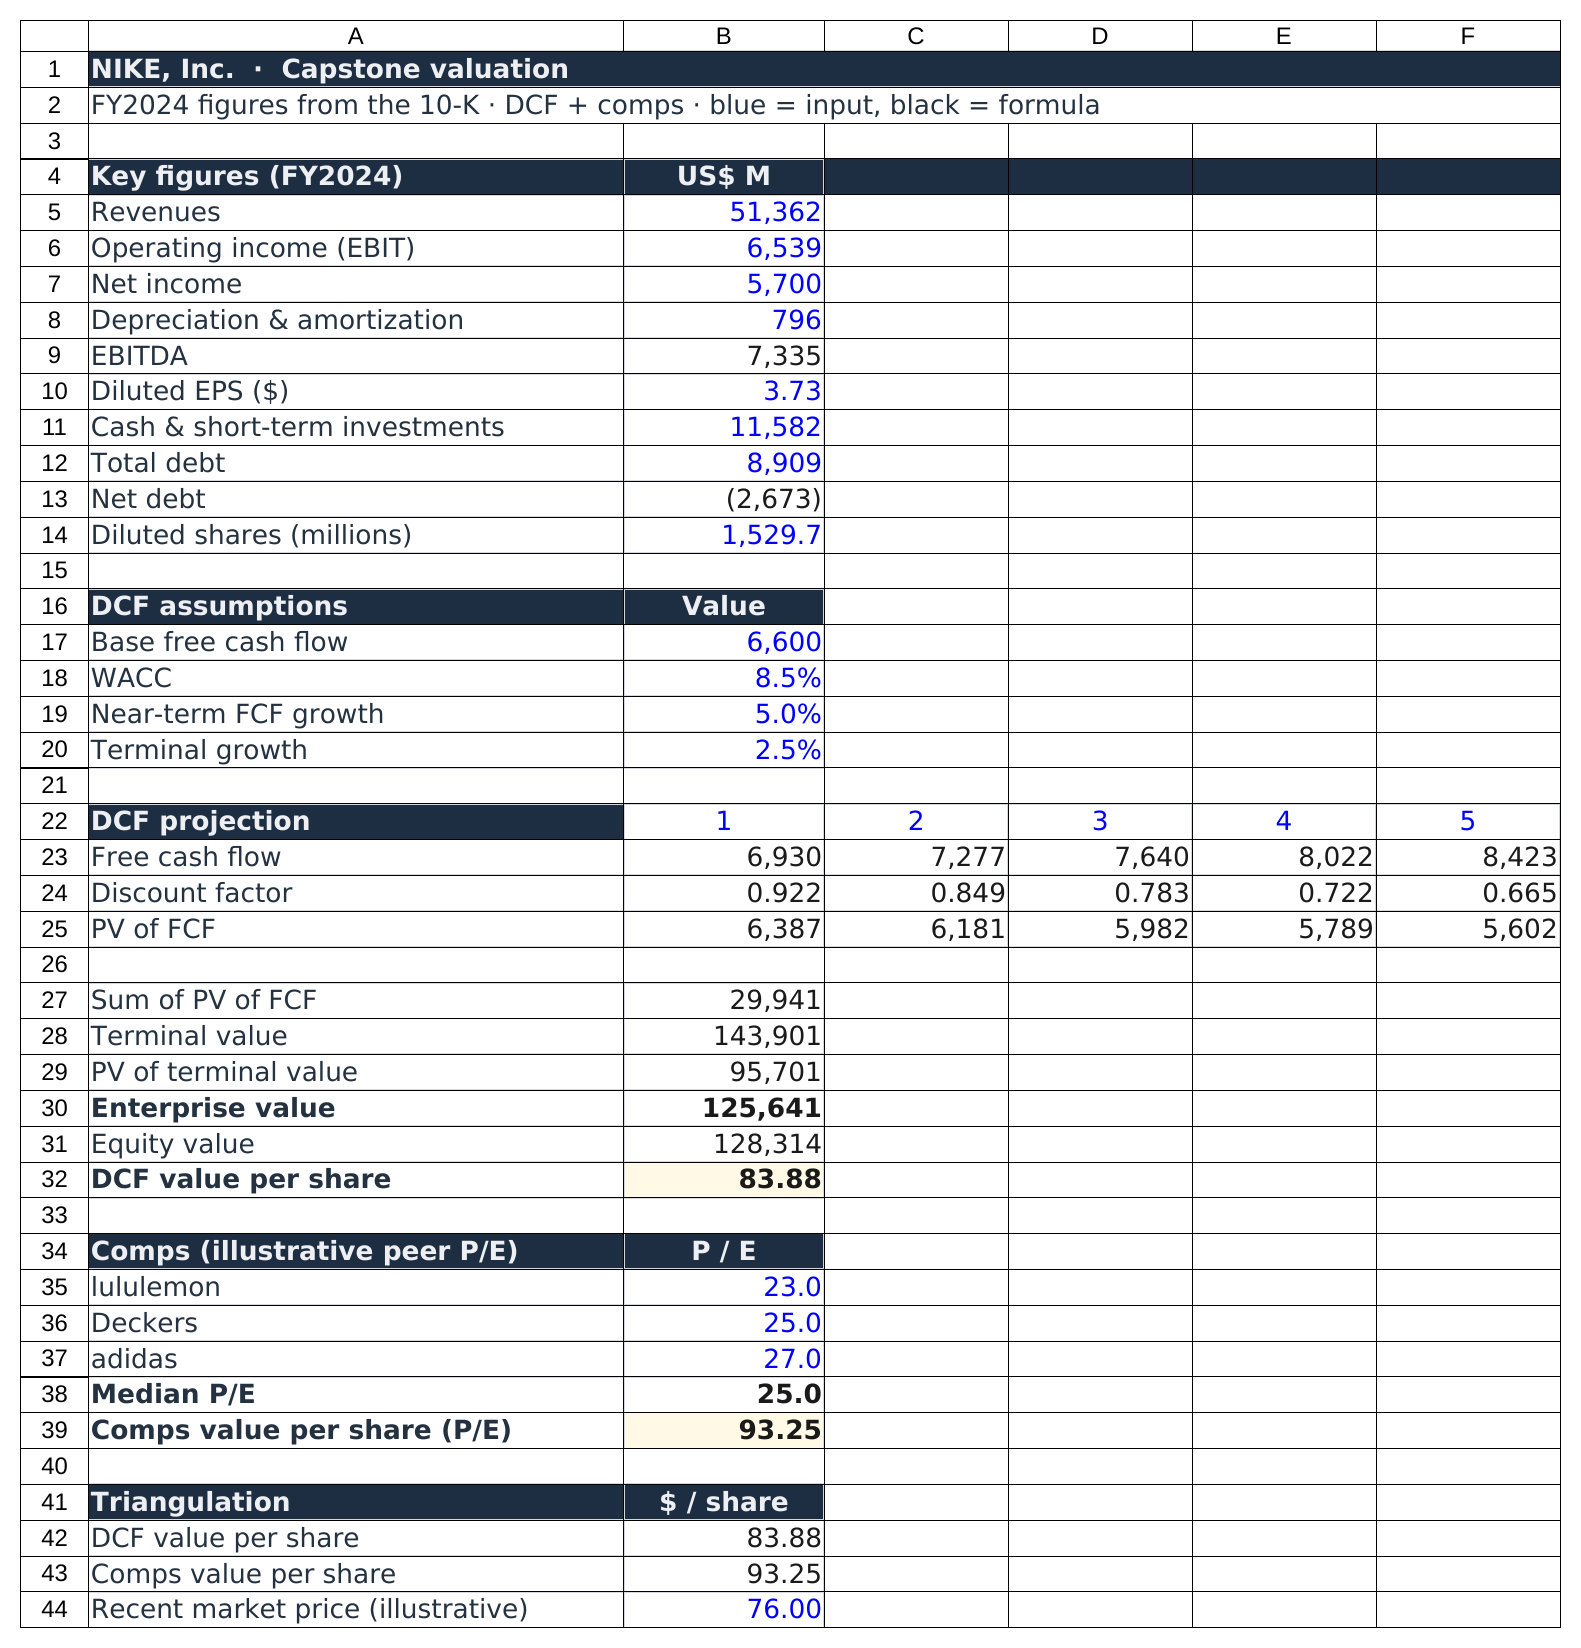
Nike is the largest athletic footwear and apparel company in the world. Fiscal 2024 caught it in a soft patch: revenue was essentially flat against the prior year and management guided the next year lower. That is exactly when a valuation earns its keep, when a quality business has fallen out of favor and the question is whether the price has overshot.
| Revenues | 51,362 |
| Operating income (EBIT) | 6,539 |
| Net income | 5,700 |
| Depreciation & amortization | 796 |
| Diluted earnings per share | 3.73 |
| Cash & short-term investments | 11,582 |
| Total debt | 8,909 |
| Diluted shares outstanding (millions) | 1,529.7 |
NIKE, Inc. Form 10-K for the fiscal year ended May 31, 2024. Nike reports earnings before interest and taxes of 6,539. Cash and short-term investments and total debt combine the relevant balance-sheet lines. View the filing on SEC EDGAR ↗.
| DCF value per share | $83.88 |
| Comps value per share (median peer P/E 25× × EPS 3.73) | $93.25 |
| Recent market price (illustrative) | $76.00 |
Verdict. Both intrinsic estimates sit above the illustrative price, so on these base-case assumptions Nike screens as modestly undervalued, a durable brand the market has marked down on near-term weakness. The analyst's real question is whether the slowdown is a passing stumble or a structural decline. The model says that if Nike merely returns to mid-single-digit growth, today's price looks low. That is a judgment about the business, which is the work the valuation exists to frame.
Nike, the guided walkthrough model to verdict
Step 1 · Decide on a base free cash flow
Operating cash flow was 7,429 and capital expenditures were 812, so reported free cash flow was 7,429 − 812 = 6,617. Nothing in the year looks distorted by a large one-time item, so no normalizing is needed. We round to a base of 6,600.
Step 2 · Run the DCF
Grow the 6,600 at 5% a year for five years, discount at an 8.5% WACC appropriate for a stable but cyclical consumer brand, and add a terminal value at 2.5% growth. That gives an enterprise value near 125,600. Nike holds more cash than debt, so net debt = 8,909 − 11,582 = −2,673, a net cash position. Subtracting a negative adds it back, so equity value is about 128,300, and dividing by 1,529.7 diluted shares gives about $83.88.
Step 3 · Cross-check with comps
Against athletic and premium-apparel peers at illustrative price-to-earnings multiples of 23, 25, and 27, the median 25 times Nike's diluted EPS of 3.73 implies about $93.25. The two methods bracket a range in the mid-80s to low-90s.
Compute Nike's EBITDA: operating income (EBIT) plus depreciation and amortization.
| Operating income (EBIT) | 6,539 |
| Depreciation & amortization | 796 |
Correct.
EBITDA adds D&A back to operating income.
Worked solution
- 6,539 + 796 = 7,335.
Compute net debt: total debt minus cash and short-term investments. A negative answer means a net cash position.
| Total debt | 8,909 |
| Cash & short-term investments | 11,582 |
Correct, Nike holds net cash.
Total debt minus the cash that could repay it.
Worked solution
- 8,909 − 11,582 = −2,673.
- Net cash is added to enterprise value, not subtracted, when bridging to equity value.
The result hangs on Nike returning to growth. Push the near-term rate down to 2% or lift the WACC to 9.5% and the DCF falls toward the market price. The honest output is a range, and the real debate is about the brand, not the spreadsheet.
The Coca-Cola Company (KO) · FY2024, ended December 31, 2024
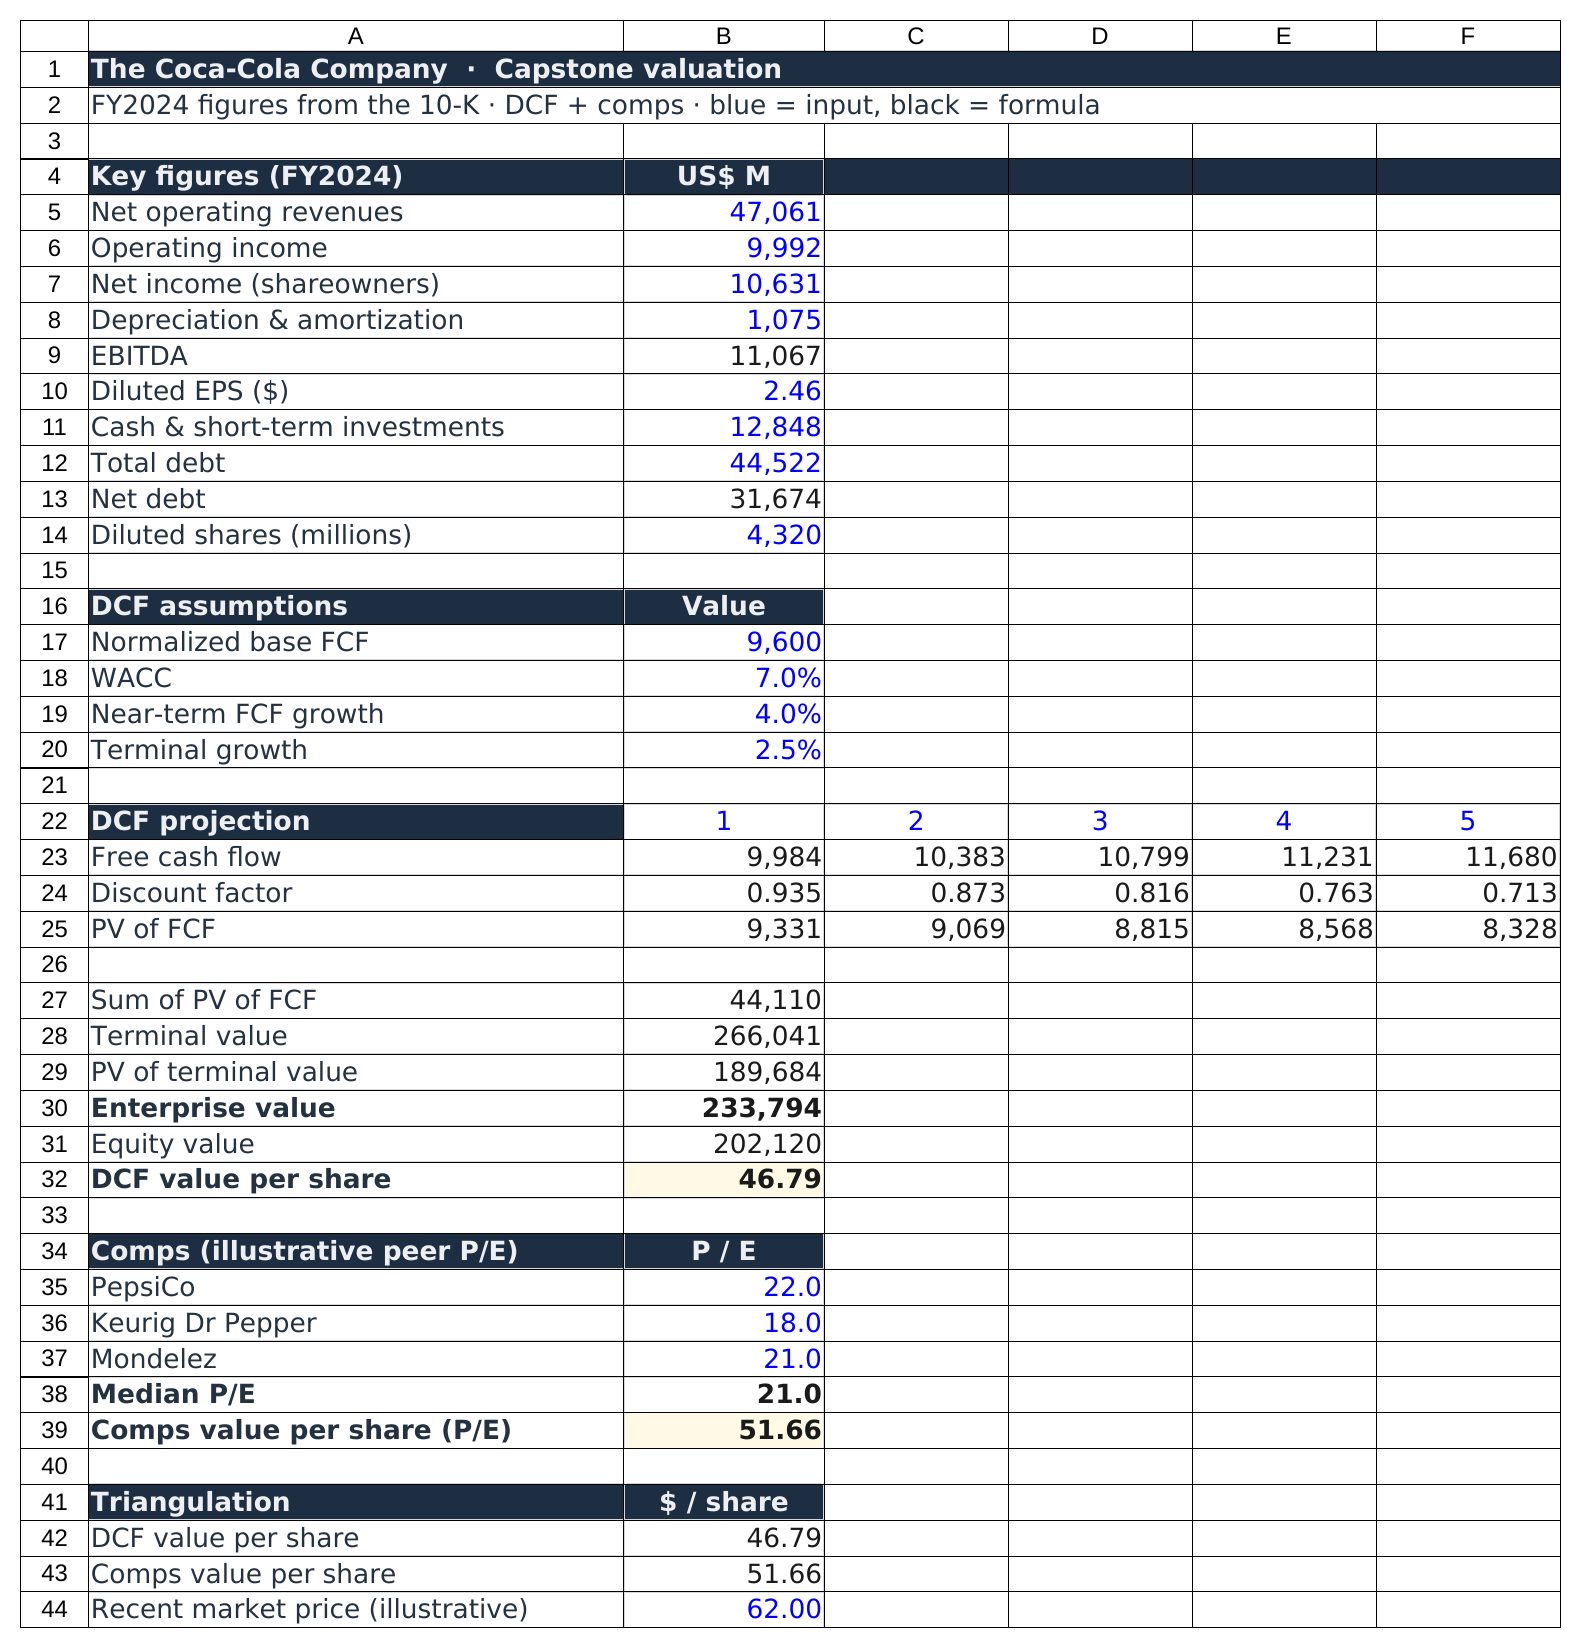
Coca-Cola is a defensive consumer staple, a slow and steady grower with one of the most durable brands in the world. Its FY2024 valuation turns on a single judgment in the cash flow statement, which makes it the best of the three for learning to normalize.
| Net operating revenues | 47,061 |
| Operating income | 9,992 |
| Net income (to shareowners) | 10,631 |
| Depreciation & amortization | 1,075 |
| Diluted earnings per share | 2.46 |
| Cash & short-term investments | 12,848 |
| Total debt | 44,522 |
| Diluted shares outstanding (millions) | 4,320 |
The Coca-Cola Company Form 10-K for the fiscal year ended December 31, 2024. View the filing on SEC EDGAR ↗.
| DCF value per share | $46.79 |
| Comps value per share (median peer P/E 21× × EPS 2.46) | $51.66 |
| Recent market price (illustrative) | $62.00 |
Verdict. Both intrinsic estimates, about $47 from the DCF and about $52 from comps, sit below the illustrative price near $62. On the base case the market is paying more for Coca-Cola than the cash and the peer multiples justify. The better question is what would have to be true to support $62: faster growth, a lower discount rate for a famously durable brand, or a premium for one of the steadiest dividend records anywhere. The valuation does not end the argument, it shows exactly which assumptions the price depends on.
Coca-Cola, the guided walkthrough model to verdict
Step 1 · Normalize the cash flow
This is where the course earns its keep. A lazy DCF starts from reported free cash flow, which for Coca-Cola in FY2024 was only 6,805 − 2,064 = 4,741, far below its usual level. The reason is in the notes: operating cash flow was depressed by a large one-time deposit Coca-Cola made with the tax authorities while it disputes an IRS assessment. That payment is real cash, but it is not the recurring cost of selling beverages, so we normalize free cash flow back to about 9,600 and say so out loud. This is the quality-of-earnings discipline of Module 15, choosing the base cash flow the model deserves rather than the one the year happened to report.
Step 2 · Run the DCF
Grow the 9,600 at 4% for five years, discount at a 7.0% WACC suited to a stable, low-beta business, and add a terminal value at 2.5% growth. Enterprise value lands near 233,800. Subtract net debt of 44,522 − 12,848 = 31,674 and divide by 4,320 shares for about $46.79.
Step 3 · Cross-check with comps
Against branded-beverage and snack peers at illustrative multiples of 22, 18, and 21, the median 21 times an EPS of 2.46 implies about $51.66.
Compute Coca-Cola's EBITDA: operating income plus depreciation and amortization.
| Operating income | 9,992 |
| Depreciation & amortization | 1,075 |
Correct.
EBITDA adds D&A back to operating income.
Worked solution
- 9,992 + 1,075 = 11,067.
Compute net debt: total debt minus cash and short-term investments.
| Total debt | 44,522 |
| Cash & short-term investments | 12,848 |
Correct.
Total debt minus the cash that could repay it.
Worked solution
- 44,522 − 12,848 = 31,674.
Feeding one year of reported cash flow straight into a perpetuity. A single year can be distorted by a tax deposit, a settlement, or a working-capital swing. Strip out what will not recur and value the business on the cash it normally produces.
Costco Wholesale Corporation (COST) · FY2024, ended September 1, 2024
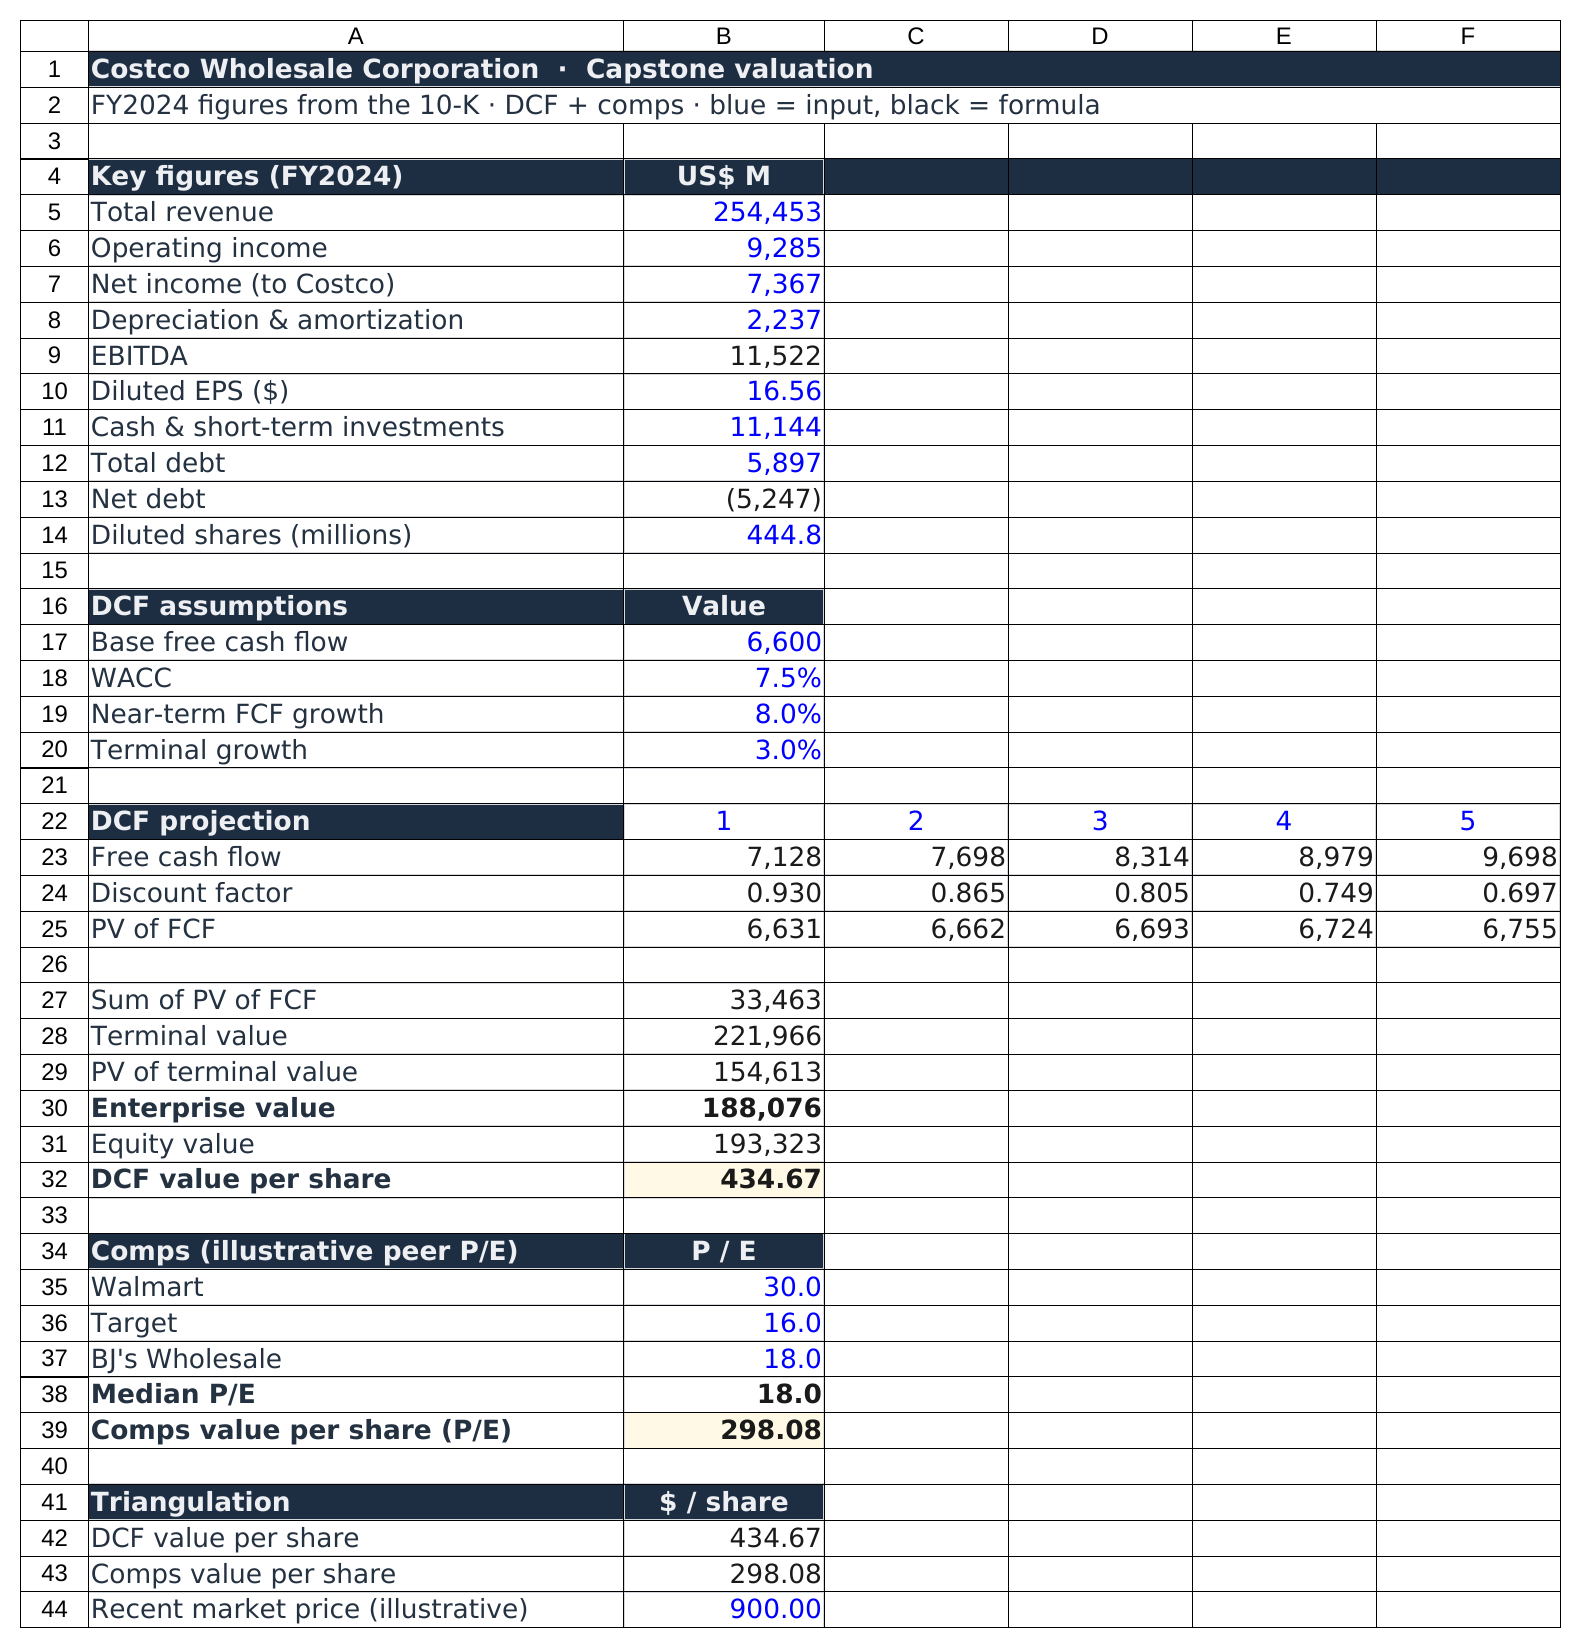
Costco is a membership warehouse retailer whose customers pay an annual fee for the privilege of shopping. That fee is almost pure profit, and a famously loyal base gives Costco some of the steadiest growth in retail. It is also the hardest of the three to value, because the market prices it like almost nothing else.
| Total revenue | 254,453 |
| Operating income | 9,285 |
| Net income (to Costco) | 7,367 |
| Depreciation & amortization | 2,237 |
| Diluted earnings per share | 16.56 |
| Cash & short-term investments | 11,144 |
| Total debt | 5,897 |
| Diluted shares outstanding (millions) | 444.8 |
Costco Wholesale Corporation Form 10-K for the fiscal year ended September 1, 2024. Total revenue is net sales of 249,625 plus membership fees of 4,828. Share counts are reported in thousands in the filing and shown here in millions. View the filing on SEC EDGAR ↗.
| DCF value per share | $434.67 |
| Comps value per share (median peer P/E 18× × EPS 16.56) | $298.08 |
| Recent market price (illustrative) | $900.00 |
Verdict. Both intrinsic estimates land far below the illustrative price near $900, which puts Costco at roughly 54 times earnings. This is the textbook case of a wonderful business at a demanding price. A plain five-year DCF on 8% growth simply cannot reach $900, and no obvious peer trades at Costco's multiple, so comps understate it too. The market is paying for decades of durable compounding and pricing power that a base-case model does not capture. The analyst's job is to decide whether that premium is justified, not to pretend the gap is an error. Quality and price are separate questions, and Costco is where that lesson bites hardest.
Costco, the guided walkthrough model to verdict
Step 1 · Decide on a base free cash flow
Operating cash flow was 11,339 and capital expenditures were 4,710, so reported free cash flow was 11,339 − 4,710 = 6,629. Note that much of Costco's capital spending builds new warehouses, so it funds growth rather than just maintaining the base. We use a base of 6,600, mindful that this is conservative for a company reinvesting to expand.
Step 2 · Run the DCF
Grow the 6,600 at 8% for five years, a touch faster to reflect Costco's reliable expansion, discount at a 7.5% WACC, and add a terminal value at 3.0% growth. Enterprise value lands near 188,100. Costco holds far more cash than debt, so net debt = 5,897 − 11,144 = −5,247, a net cash position that is added back. Equity value is about 193,300, and dividing by 444.8 diluted shares gives about $434.67.
Step 3 · Cross-check with comps, carefully
Against large retail peers at illustrative multiples of 30, 16, and 18, the median 18 times Costco's EPS of 16.56 implies about $298.08. Treat this with caution. None of those peers carries Costco's membership economics or its loyalty, which is exactly Module 13's warning that a multiple only transfers between genuinely similar businesses. Here the comps almost certainly understate.
Compute Costco's EBITDA: operating income plus depreciation and amortization.
| Operating income | 9,285 |
| Depreciation & amortization | 2,237 |
Correct.
EBITDA adds D&A back to operating income.
Worked solution
- 9,285 + 2,237 = 11,522.
Compute net debt: total debt minus cash and short-term investments. A negative answer means a net cash position.
| Total debt | 5,897 |
| Cash & short-term investments | 11,144 |
Correct, Costco holds a large net cash balance.
Total debt minus the cash that could repay it.
Worked solution
- 5,897 − 11,144 = −5,247.
When a careful model says $435 and the market says $900, the beginner declares the market wrong. The analyst asks what the market knows that the model does not: a multi-decade runway, pricing power, and a membership flywheel a five-year forecast cannot hold. The gap is the debate, and naming it precisely is the whole job.
Whichever you chose, you read a real filing, judged the cash flow, valued a company two independent ways, and reached a reasoned view on price versus value, with every assumption stated so anyone can challenge it. That is what a financial analyst does. Pass the final exam as well and you can generate your certificate of completion.